
NCERT Solutions for Class 9 Matha 2 Chapter 10: How Quantities Combine: Understanding Data
Exercise Set 10.1
Question 1:
The average score of students on a test in Section A is 72 and that of students in Section B is 76. What is the combined average of both the sections given that Section A has 30 students and Section B has 25 students?
सेक्शन A के विद्यार्थियों का परीक्षा में औसत अंक 72 है और सेक्शन B के विद्यार्थियों का औसत अंक 76 है। यदि सेक्शन A में 30 विद्यार्थी और सेक्शन B में 25 विद्यार्थी हैं, तो दोनों सेक्शनों के विद्यार्थियों का संयुक्त औसत अंक कितना होगा?
Solution:
Average score of Section A = 72
Number of students in Section A = 30
Total score of Section A = 30 × 72 = 2160
Average score of Section B = 76
Number of students in Section B = 25
Total score of Section A = 25 × 76 = 1900
Therefore,
Combined average =
\(\quad\quad\quad\quad\) =
\(\quad\quad\quad\quad\) = = 73.82
Hence, the combined average score is approximately 73.82.
Question 2:
A farmer mixes three equal quantities of fertilisers. The first one contains nitrogen, thc second contains nitrogen, and the third contains nitrogen. What is the fraction of nitrogen in the mixture.
एक किसान तीन उर्वरकों (Fertilisers) की समान मात्रा मिलाता है। पहले उर्वरक में नाइट्रोजन, दूसरे उर्वरक में नाइट्रोजन और तीसरे उर्वरक में नाइट्रोजन है। मिश्रण में नाइट्रोजन का भिन्न (Fraction) कितना होगा?
Solution:
Since equal quantities of the three fertilisers are mixed, the fraction of nitrogen in the mixture is the average of their nitrogen fractions.
Fraction of nitrogen =
\(\quad\quad\quad\quad\) =
LCM of 10, 50 and 60 = 300
\(\quad\quad\quad\quad\) =
\(\quad\quad\quad\quad\) = ÷ 3
\(\quad\quad\quad\quad\) = =
Hence, the fraction of nitrogen in the mixture is .
Question 3:
(Sridharacarya, Patlganita, c. 750 CE) In ancienf India, Varna was the measure of gold purity. A purity of 16 varna meant pure gold; in general, a purity of k varna meant thal the gold-alloy k/16 gold and the rest impurities. (Now the term used is karat; 16 Varna = 24 karat.)
Suppose a goldsmith melts together three pieces of gold: 9 units at 12 varna, 5 units at 10 varna, and 17 units at 11 varna. Find the purity in varna of the combined gold.
(श्रीधराचार्य, पाटीगणित, लगभग 750 ईस्वी) प्राचीन भारत में सोने की शुद्धता मापने के लिए वर्ण (Varna) का उपयोग किया जाता था। 16 वर्ण की शुद्धता का अर्थ शुद्ध सोना था। सामान्यतः, यदि सोने की शुद्धता \(k\) वर्ण होती थी, तो इसका अर्थ था कि सोने की मिश्रधातु में \(k/16\) भाग सोना और शेष भाग अशुद्धियाँ थीं। (आजकल इसके लिए कैरेट शब्द का प्रयोग किया जाता है; 16 वर्ण = 24 कैरेट।)
मान लीजिए कि एक सुनार सोने के तीन टुकड़ों को पिघलाकर एक साथ मिलाता है: 12 वर्ण की शुद्धता वाला 9 इकाई सोना, 10 वर्ण की शुद्धता वाला 5 इकाई सोना, 11 वर्ण की शुद्धता वाला 17 इकाई सोना।
मिश्रित सोने की शुद्धता वर्ण में ज्ञात कीजिए।
Solution:
Purity of combined gold is the weighted average of the purities of the three pieces.
Purity =
=
= = 11.13
Hence, the purity of the combined gold is approximately 11.13 varna.
Question 4:
The average rainfall per day in the months of May, June, and July in a certain location are 3.5 mm, 10 mm and 8.7 mm respectively. Write an expression that gives their combined average.
किसी विशेष स्थान पर मई, जून और जुलाई महीनों में प्रतिदिन होने वाली औसत वर्षा क्रमशः 3.5 मिमी, 10 मिमी और 8.7 मिमी है। इन तीनों महीनों की संयुक्त औसत वर्षा ज्ञात करने वाला व्यंजक (Expression) लिखिए।
Solution:
Since May has 31 days, June has 30 days, and July has 31 days.
The combined average rainfall per day =
=
This expression gives the combined average rainfall per day for May, June and July.
Question 5:
Calculate the concentration of spice mix in these two scenarios.
(i) A 100 mL kashayamt/kadha with 5% spice mix, a 200 mL one with 10% spice mix, and a 300 mL one with 15% spice mix are combined.
(ii) A 300 mL kashayamt/kadha with 5% spice mix, a 200 mL one with 10% spice mix, and a 100 mL one with 15% spice mix are mixed.
मसालों के मिश्रण की सांद्रता (Concentration of Spice Mix) की गणना निम्नलिखित दो परिस्थितियों में कीजिए।
(i) 5% मसाले के मिश्रण वाला 100 mL काढ़ा, 10% मसाले के मिश्रण वाला 200 mL काढ़ा तथा 15% मसाले के मिश्रण वाला 300 mL काढ़ा एक साथ मिला दिए जाते हैं।
(ii) 5% मसाले के मिश्रण वाला 300 mL काढ़ा, 10% मसाले के मिश्रण वाला 200 mL काढ़ा तथा 15% मसाले के मिश्रण वाला 100 mL काढ़ा एक साथ मिला दिए जाते हैं।
Solution:
(i) The concentration of spice mix =
=
=
=
=
= × 100% = 11 %.
(ii) The concentration of spice mix =
=
=
=
=
= × 100% = 8 %.
Exercise Set 10.2
Question 1:
Savitri’s marks in Kashmiri are as follows: 35 out of 50 in internal tests, 44 out of 60 in the project, and 80 out of 100 in the final exam. The annual percentage score is calculated by combining the internals, project, and final exam in the ratio 3: 4: 5. Which of the following expression(s) gives her annual score (as a percentage) in Kashmiri?
कश्मीरी विषय में सावित्री के अंक निम्नलिखित हैं: आंतरिक परीक्षाओं (Internal Tests) में 50 में से 35 अंक, प्रोजेक्ट (Project) में 60 में से 44 अंक, अंतिम परीक्षा (Final Exam) में 100 में से 80 अंक।
वार्षिक प्रतिशत (Annual Percentage) की गणना आंतरिक परीक्षाओं, प्रोजेक्ट और अंतिम परीक्षा के अंकों को क्रमशः 3 : 4 : 5 के अनुपात में मिलाकर की जाती है।
निम्नलिखित में से कौन-सा/कौन-से व्यंजक (Expressions) कश्मीरी विषय में सावित्री का वार्षिक प्रतिशत अंक दर्शाते हैं?
(i)
(ii)
(iii) × 100
(iv)
Solution:
Annual score in Kashmiri = × 100.
Therefore, the expression (iii) is correct.
Exercise Set 10.3
Question 1:
A stationery shop owner made ₹8000 selling books, of which 30% is the proflt amount, and ₹1000 selling book covers, of which 50% is the proflt amount. what is the percentage of proflt on the total sales?
एक स्टेशनरी की दुकान के मालिक ने किताबें बेचकर ₹8000 कमाए, जिसमें 30% लाभ (Profit) शामिल है। उसने किताबों के कवर बेचकर ₹1000 कमाए, जिसमें 50% लाभ शामिल है। कुल बिक्री (Total Sales) पर लाभ का प्रतिशत कितना होगा?
Solution:
Profit percentage on the total sales
= × 100%
= × 100%
= × 100%
= × 100%
= × 100%
= 32 %
Hence, the percentage of profit on the total sales is 32 %.
Question 2:
A white stork’s migration is tracked. The average daily distance travelled, calculated over 20 days, is 14.5 km. On the 21st day, it flew 55 km. What is the average daily distance travelled over these 21 days? Make a guess before you calculate.
एक सफेद सारस (White Stork) के प्रवास (Migration) पर नज़र रखी जा रही है। 20 दिनों में तय की गई औसत दैनिक दूरी 14.5 किमी है। 21वें दिन उसने 55 किमी की दूरी तय की। इन सभी 21 दिनों की औसत दैनिक दूरी कितनी होगी? गणना करने से पहले उत्तर का अनुमान (Guess) लगाइए।
Solution:
Guess: Since the distance on the 21st day (55 km) is much greater than the previous average (14.5 km), the new average should be greater than 14.5 km but much less than 55 km.
Average distance =
=
=
= = 16.43 km
Hence, the average daily distance travelled over 21 days is 16.43 km.
Question 3:
A 600 mL solution with 5% salt is mixed with a 300 mL solution with 8% sugar. What are the concentrations of salt and sugar in the mixture?
(i) SaIt: 5%, Sugar: 8% (ii) Salt: 13%, Sugar: 3%
(iii) Salt:6%, Sugar: 6% (iv) Salt: 5.55%, Sugar: 8.88%
(v) Salt:3.33%, Sugar: 2.67% (vi) Salt: 4.1%, Sugar: 7.08%
600 mL का 5% नमक (Salt) वाला घोल, 300 mL के 8% चीनी (Sugar) वाले घोल के साथ मिलाया जाता है। मिश्रण में नमक और चीनी की सांद्रता (Concentration) कितनी होगी?
(i) नमक: 5%, चीनी: 8% (ii) नमक: 13%, चीनी: 3%
(iii) नमक: 6%, चीनी: 6% (iv) नमक: 5.55%, चीनी: 8.88%
(v) नमक: 3.33%, चीनी: 2.67% (vi) नमक: 4.1%, चीनी: 7.08%
Solution:
Total volume of the mixture = 600 + 300 = 900 mL
Salt in the first solution = 5% of 600 mL
= × 600 = 30 mL
Therefore,
Salt concentration = × 100% = 3.33%
Sugar in the second solution = 8% of 300 mL
= × 300 = 24 mL
Therefore,
Sugar concentration = × 100% = 2.67%
Hence, the correct answer is (v), Salt: 3.33%, Sugar: 2.67%.

Question 4:
At a panipuri (golgappa) stall, the concentration of spice in the pani (spiced water) was 8%. Many customers complained that it was too spicy. What quantity of regular water should be mixed into the 10 litres of pani so that the spice level is reduced to (34)th of the original concenratron?
एक पानीपुरी (गोलगप्पे) की दुकान पर पानी में मसालों की सांद्रता 8% थी। कई ग्राहकों ने शिकायत की कि पानी बहुत तीखा है।
मसालों की सांद्रता को उसकी मूल सांद्रता के \(\frac{3}{4}\) भाग तक कम करने के लिए 10 लीटर मसाले वाले पानी में कितनी मात्रा में सादा पानी मिलाना चाहिए?
Solution:
Let y be the quantity of regular water to be added.
Original concentration of spice = 8%
New concentration = × 8% = 6%
New concentration of spice in the mixture =
0.06 =
0.06(10 + y) = 0.8
0.6 + 0.06y = 0.8
0.06y = 0.8 – 0.6
0.06y = 0.2
y = = = 3 L
Therefore, 3 L litres of regular water should be added.
Question 5:
A physical fitness evaluation is being undertaken. The final marks are calculated by combining the marks for strength, flexibility, and agility in the ratio 4: 5 : 6. Rashi has scored 60, 65, and 70. Keerthi has scored 55, 65, and 75 respectively.
(i) Find out whose total is more without calculating.
(ii) What are their final marks?
एक शारीरिक फिटनेस मूल्यांकन (Physical Fitness Evaluation) किया जा रहा है। अंतिम अंक शक्ति (Strength), लचीलापन (Flexibility) और फुर्ती (Agility) के अंकों को 4 : 5 : 6 के अनुपात में मिलाकर निर्धारित किए जाते हैं।
राशि (Rashi) ने क्रमशः 60, 65 और 70 अंक प्राप्त किए हैं। कीर्ति (Keerthi) ने क्रमशः 55, 65 और 75 अंक प्राप्त किए हैं।
(i) बिना गणना किए बताइए कि किसके कुल अंक अधिक होंगे?
(ii) दोनों के अंतिम अंक ज्ञात कीजिए।
Solution:
The final marks are calculated in the ratio 4 : 5 : 6.
(i) Rashi’s marks are 60, 65, 70 while Keerthi’s marks are 55, 65, 70.
Keerthi has 5 marks less in strength but 5 marks more in agility. Since agility has a greater weight than strength, Keerthi’s final marks will be more.
(ii) Rashi’s final marks = = = 65.
Keerthi’s final marks = = = 66.
Therefore, Keerthi’s final marks are more.
Question 6:
A restaurant collected ratings from 10 customers on a scale of 1 to 5. The resulting data is shown in the table below.
एक रेस्तराँ ने 10 ग्राहकों से 1 से 5 के पैमाने पर रेटिंग (Rating) एकत्र की। प्राप्त आँकड़े नीचे दी गई तालिका में दर्शाए गए हैं।
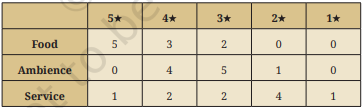
What is the average rating if the metrics are combined with the weights food : ambience : service = 6 : 5 : 4?
दि भोजन (Food), वातावरण (Ambience) और सेवा (Service) की रेटिंग को 6 : 5 : 4 के भार (Weights) के अनुपात में मिलाया जाए, तो औसत रेटिंग कितनी होगी?
Solution:
Average rating for food = = = 4.5
Average rating for ambience = = = 3.1
Average rating for service = = = 3
The weights are 6 : 5 : 4. Therefore,
Average rating =
=
= = = 3.63
Hence, the average rating of the restaurant is 3.63.
Question 7:
The following table shows the weight data of langurs in an animal facility. Without doing any computations, can you tell whether there are more male langurs or more female langurs? Or are they equal in number?
निम्नलिखित तालिका में एक पशु केंद्र (Animal Facility) में रहने वाले लंगूरों (Langurs) के वजन से संबंधित आँकड़े दिए गए हैं। बिना कोई गणना किए, क्या आप बता सकते हैं कि नर लंगूरों (Male Langurs) की संख्या अधिक है या मादा लंगूरों (Female Langurs) की? अथवा दोनों की संख्या बराबर है?
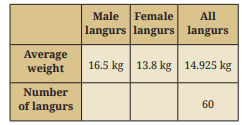
(i) Which of the following expression(s) describes the given scenario?
(i) निम्नलिखित में से कौन-सा/कौन-से व्यंजक (Expressions) दी गई परिस्थिति को दर्शाते हैं?
(a) = 14.925
(b) = –14.925
(c) = –14.925
(d) = –14.925
(ii) Find out how many male langurs are present.
(ii) नर लंगूरों (Male Langurs) की कुल संख्या ज्ञात कीजिए।
(iii) A female langur weighing 15.2 kg is admitted to the facility. What is the average weight of the female langurs after this?
(iii) 15.2 किलोग्राम वजन वाली एक मादा लंगूर (Female Langur) को पशु केंद्र में लाया जाता है। इसके बाद मादा लंगूरों का औसत वजन कितना होगा?
(iv) Two male langurs weighing 16.9 kg and 16.1 kg are released from the facility. What is the average weight of the male langurs after this?
(iv) 16.9 किलोग्राम और 16.1 किलोग्राम वजन वाले दो नर लंगूरों को पशु केंद्र से छोड़ दिया जाता है। इसके बाद नर लंगूरों का औसत वजन कितना होगा?
(v) Now suppose one of the male langurs lost 1 kg of weight. What is the average weight of all the male langurs after this?
(v) अब मान लीजिए कि नर लंगूरों में से एक का वजन 1 किलोग्राम कम हो जाता है। इसके बाद सभी नर लंगूरों का औसत वजन कितना होगा?
Solution:
Let the number of male langurs be x and the number of female langurs be y.
The total number of langurs is 60.
(i) The combined average is 14.925 kg. Therefore,
= 14.925
Hence, option (a) describes the given situation.
(ii) Since x + y = 60
y = 60 – x ……………. (1)
Thus,
= 14.925
16.5x + 13.8y = 60 × 14.925
16.5x + 13.8(60 – x) = 895.5
16.5x + 828 – 13.8x = 895.5
2.7x = 895.5 – 828
2.7x = 67.5
x = 25
Therefore, there are 25 male langurs.
(iii) Number of female langurs = y = 60 – 25 = 35
After adding a female langur of 15.2 kg weight,
Average weight of female langurs =
=
=
= = 13.84 kg
Therefore, the average weight is 13.84 kg.
(iv) After releasing two male langurs weighing 16.9 kg and 16.1 kg,
Average weight of male langurs =
=
=
= = 16.5 kg
(v) Total weight of 23 langurs = 23 × 16.5 = 379.5.
After one of the male langurs lost 1 kg of weight,
Average weight of male langurs =
= = 16.46 kg
Hence, the average weight of the male langurs is 16.46 kg.
Question 8:
Dorjee has collected 1 Iitre of water from the Dead Sea! Using the information in the table, answer the following questions. A calculator can be used if necessary.
दोर्जे (Dorjee) ने मृत सागर (Dead Sea) से 1 लीटर पानी एकत्र किया है। तालिका में दी गई जानकारी का उपयोग करके निम्नलिखित प्रश्नों के उत्तर दीजिए। आवश्यकता पड़ने पर कैलकुलेटर का उपयोग किया जा सकता है।
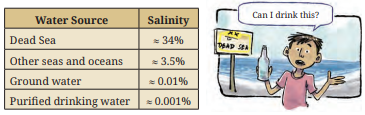
(i) What is the salinity of the mixture if he mixes 1 litre of water from the Dead Sea with 2 litres of purified drinking water?
(i) यदि वह मृत सागर (Dead Sea) से 1 लीटर पानी में 2 लीटर शुद्ध पेयजल (Purified Drinking Water) मिलाता है, तो मिश्रण की लवणता (Salinity) कितनी होगी?
(ii) Is it possible to mix water from the Dead Sea and purified drinking water to get a mixture with the salinity of groundwater? Why/Why not? What quantity of purified drinking water should Dorjee mix with 1 litre of water from the Dead Sea to get a mixture having the salinity of groundwater?
(ii) क्या मृत सागर के पानी और शुद्ध पेयजल को मिलाकर भूजल (Groundwater) के समान लवणता वाला मिश्रण प्राप्त करना संभव है? क्यों या क्यों नहीं? भूजल के समान लवणता वाला मिश्रण प्राप्त करने के लिए दोर्जे को मृत सागर के 1 लीटर पानी में कितनी मात्रा में शुद्ध पेयजल मिलाना चाहिए?
(iii) Is it possible to mix water from the Dead Sea and groundwater to get a mixtue with the salinity of purified drinking water? Why/Why not? What quantity of groundwater should he mix with 1 litre of water from the Dead Sea to get a mixture having the salinity of purifled drinking water?
(iii) क्या मृत सागर के पानी और भूजल को मिलाकर शुद्ध पेयजल के समान लवणता वाला मिश्रण प्राप्त करना संभव है? क्यों या क्यों नहीं? शुद्ध पेयजल के समान लवणता वाला मिश्रण प्राप्त करने के लिए उसे मृत सागर के 1 लीटर पानी में कितनी मात्रा में भूजल मिलाना चाहिए?
Solution:
(i) Salinity of the mixture = = = 11.334%.
(ii) Yes, it is possible because 0.01% lies between 34% and 0.001%.
Let x L of purified drinking water be mixed with 1 L of Dead Sea water.
= 0.01
34 + 0.001x = 0.01 + 0.01x
34 – 0.01 = 0.01x – 0.001x
33.99 = 0.009x
x = = 3776.67 L
Therefore, 3776.67 L of purified drinking water is required.
(iii) No, it is not possible.
The salinity of a mixture of Dead Sea water (34%) and groundwater (0.01%) will always lie between 0.01% and 34%.
But 0.001% < 0.01%
Therefore, purified drinking water salinity cannot be obtained.
Exercise Set 10.4
Question 1:
The following stacked column chart shows the number of animal species in the IUCN Red List, by class, over time.
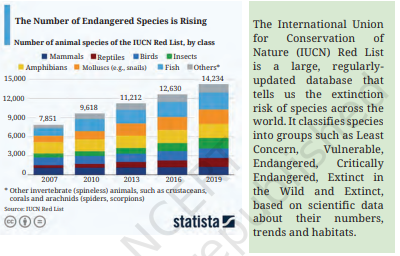
(i) What does the number 14,234 on the top of the column 2019 represent?
Solution:
The number 14,234 represents the total number of endangered animal species across all classes that were on the IUCN Red List in 2019.
(ii) Approximately how many reptile species were in the list in 2016?
Solution:
1200 reptiles.
(iii) Which class(es) of species have seen a relatively small increase in count between 2007 and 2019?
Solution:
Birds, mammals, and amphibians.
2.
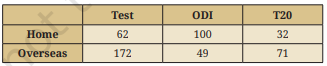
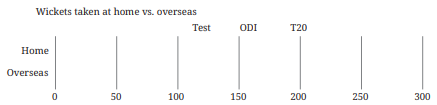
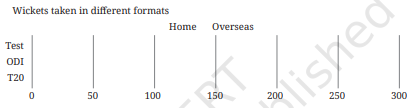
The wickets taken by a bowler in International Cricket matches till 2025 are shown in the table. Complete the given stacked bar charts (the bar lengths can be approximate),
वर्ष 2025 तक अंतरराष्ट्रीय क्रिकेट मैचों में एक गेंदबाज द्वारा लिए गए विकेटों की संख्या नीचे दी गई तालिका में दर्शाई गई है।
दिए गए स्टैक्ड बार चार्ट (Stacked Bar Charts) को पूरा कीजिए। (बार की लंबाई अनुमानित हो सकती है।)
(i) comparing the total wickets taken at home vs. overseas:
(i) घरेलू मैदान (Home) और विदेशी मैदान (Overseas) पर लिए गए कुल विकेटों की तुलना कीजिए।
Solution:
(ii) The total wickets taken in each format:
(ii) प्रत्येक प्रारूप (Format) में लिए गए कुल विकेटों की संख्या ज्ञात कीजिए।
Solution:
Exercise Set 10.5
Quesrtion 1:
The smart watch data of 5 people was tracked from Monday to Friday. The recorded data tells us how many hours each person spent lying down, sitting, and standing or moving around, etc., as shown in the following table.
Table 10.3: Average number of hours spent per day (Monday – Friday) lying down, sitting, and standing or moving around, etc., of 5 people
सोमवार से शुक्रवार तक 5 लोगों की स्मार्टवॉच (Smart Watch) के आँकड़ों को रिकॉर्ड किया गया। रिकॉर्ड किए गए आँकड़ों से पता चलता है कि प्रत्येक व्यक्ति ने प्रतिदिन औसतन कितने घंटे लेटकर (Lying Down), बैठकर (Sitting) तथा खड़े होकर या इधर-उधर घूमकर (Standing or Moving Around) बिताए।
तालिका 10.3: 5 व्यक्तियों द्वारा सोमवार से शुक्रवार तक प्रतिदिन औसतन लेटने, बैठने तथा खड़े रहने या इधर-उधर घूमने आदि में बिताए गए घंटों की संख्या।
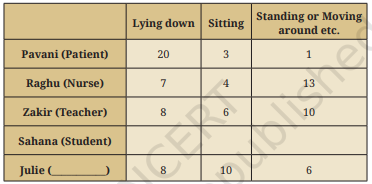
(i) How much time does Sahana spend per day in each of these body-states? Make a reasonable guess and fill her row in the table.
(i) सहाना (Sahana) प्रतिदिन इन तीनों शारीरिक अवस्थाओं (Body-states) में कितना समय बिताती है? एक उचित अनुमान लगाइए और तालिका में उसकी पंक्ति (Row) भरिए।
Solution:
(ii) Guess what activity or work Julie could be engaged in based on the data. Find out what your classmates’ guesses are.
(ii) दिए गए आँकड़ों के आधार पर अनुमान लगाइए कि जूली कौन-सा कार्य या गतिविधि कर रही होगी। पता लगाइए कि आपके सहपाठियों के क्या-क्या अनुमान हैं।
Solution:
Tailor.
(iii) Complete the chart below based on the tabular data.
(iii) तालिका में दिए गए आँकड़ों के आधार पर नीचे दिए गए चार्ट (Chart) को पूरा कीजिए।
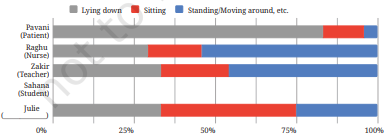
Solution:
End-of-Chapter Exercise
Question 1:
In cricket, the run rate is the average number of runs scored per over. In a T20 match, a team scored 6 runs in the first over making the run rate 6.
(i) In the second over they scored 12 runs. What is the run rate now?
Solution:
Runs scored in the first over = 6
Runs scored in the second over = 12
Total runs scored = 6 + 12 = 18
Total overs = 2
Run rate = = = 9.
Therefore, the run rate after 2 overs is 9 runs per over.
(ii) After over 19, their run rate was 6. What is the run rate after 20 overs, given the team made 12 runs in the last over?
Solution:
Run rate after 19 overs = 6
Total runs scored after 19 overs = 19 × 6 = 114 runs
Runs scored in the 20th over = 12 runs
Total runs scored after 20 overs = 114 + 12 = 126 runs
Run rate after 20 overs = = = 6.3.
Therefore, the run rate after 20 overs is 6.3 runs per over.
Question 2:
Five friends who play badminton surveyed the city and collected the price of shuttlecocks across brands and types (Nylon and Feather). The following is the list of the prices, in rupees (₹), that each one compiled.
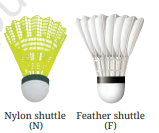
Yusuf: 40(N), 105(N), 383(F), 108(N), 165(F), 116(F)
Srikanth: 194(N), 85(N), 93(N), 121(N)
Kashvi: 49(N), 297(F), 105(N), 275(F), 40(N)
Prasanna: 124(N), 333(F), 182(N), 258(F)
Gracy: 220(F), 458(F), 129(F), 183(N)
Can you describe a way they can work together to find the average price of a shuttlecock across types?
(i) Each one calculated the average of the prices they had gathered. Suppose these are ay, as, ak, ap, ag, respectively. Write an expression that gives the combined average.
Solution:
Total number of prices of shuttlecocks collected = 6 + 4 + 5 + 4 + 4 = 23.
Given that the average prices of shuttlecocks collected by Yusuf, Srikanth, Kashvi, Prasanna, Gracy be ay, as, ak, ap, and ag.
Combined average = = =
Therefore, the expression for the combined average of shuttlecocks is .
Learn Math
(ii) Suppose an, af are the average prices of the nylon shuttlecocks and the feather shuttlecocks, respectively. Write an expression that gives the average price of a shuttlecock. Will this be equal to the answer we got using the method in the previous part?
Solution:
Total nylon shuttlecocks = 3 + 4 + 3 + 2 + 1 = 13
Total feather shuttlecocks = 3 + 0 + 2 + 2 + 3 = 10
Given that the average prices of the nylon and the feather shuttlecocks are an, af respectively.
Average price of shuttlecocks = = =
Therefore, the expression for the average price of a shuttlecock is .
Yes, it will be exactly equal.
3. Shreyas holds 25 shares of a company at an average price of ₹150, and Vaishnavi holds 5 shares of the same company at an average price of ₹150.
(i) Shreyas buys 10 shares of this company at a price of ₹30 each. What is the average price per share for him after the purchase?
Solution:
Number of shares held by Shreyas = 25
Average price of each share = ₹150
Total price of 25 shares = 25 × 150 = ₹3750
Number of additional shares bought = 10
Price of each additional share = ₹30
Total price of additional shares = 10 × 30 = ₹300
Total shares = 25 + 10 = 35
Total price of all shares = ₹3750 + ₹300 = ₹4050
Average price per share = = = ₹115.71
Therefore, the average price per share for Shreyas is approximately ₹115.71.
(ii) Vaishnavi buys some shares of this company at a price of ₹30 each and the average price per share for her after the purchase is ₹70. How many shares did she buy?
Solution:
Number of shares held by Vaishnavi = 5
Average price of each share = ₹150
Total price of 5 shares = 5 × 150 = ₹750
Let the number of additional shares bought by Vaishnavi be x.
Price of each additional share = ₹30
Total price of additional shares = ₹30x
Total shares = x + 5
Total price of all shares = 750 + 70x
Given that the average price per share = ₹70
Average price per share =
⇒ 70 =
⇒ 70(x + 5) = 750 + 30x
⇒ 70x + 350 = 750 + 30x
⇒ 70x – 30x = 750 – 350
⇒ 40x = 400
x = 10
Therefore, Vaishnavi bought 10 additional shares.
4. (Pṛthūdakasvāmī, commentary on Brahmagupta’s Brāhmasphuṭasiddhānta, c. 864 CE) A “hasta” (meaning “forearm”) refers to a unit of length measuring around 18 inches. A pool 30 hastas long is dug to different depths along its length. It is divided into 5 sections having lengths 4, 5, 6, 7, and 8 hastas, and is dug to depths of 9, 7, 7, 3, and 2 hastas, respectively. Find the mean depth of the pool.
Solution:
Mean depth = = = = = 5 hastas
Therefore, the mean depth of the pool is 5 hastas.
5. Suvarna had purchased 1g gold at ₹15k (short for ₹15,000). This is shown by point O denoting the average price of gold that she possesses. Six different scenarios are given below for her next transaction. For each scenario estimate and mark the average price of gold she will have after the transaction.

(i) Purchase 1g gold at ₹30k (ii) Purchase 2g gold at ₹30k
(iii) Purchase 1g gold at ₹10k (iv) Purchase 10g gold at ₹10k
(v) Purchase 0.5g gold at ₹30k (vi) Purchase 0.5g gold at ₹15k
Solution:
(i) Suvarna had purchased 1g gold at ₹15k.
Again, she purchased 1g gold at ₹30k.
Total gold purchased = 1 + 1 = 2 g
Total cost of gold = ₹15K + ₹30K = ₹45K
Average = = = ₹22.5K/g
(ii) Suvarna had purchased 1g gold at ₹15k.
Again, she purchased 2g gold at ₹30k.
Total gold purchased = 1 + 2 = 3 g
Total cost of gold = ₹15K + 2 × ₹30K = ₹15K + ₹60K = ₹75K
Average = = = ₹25K/g
(iii) Suvarna had purchased 1g gold at ₹15k.
Again, she purchased 1g gold at ₹10k.
Total gold purchased = 1 + 1 = 2 g
Total cost of gold = ₹15K + ₹10K = ₹25K
Average = = = ₹12.5K/g
(iv) Suvarna had purchased 1g gold at ₹15k.
Again, she purchased 10g gold at ₹10k.
Total gold purchased = 1 + 10 = 11 g
Total cost of gold = ₹15K + 10 × ₹10K = ₹15K + ₹100K = ₹115K
Average = = = ₹10.45K/g
(v) Suvarna had purchased 1g gold at ₹15k.
Again, she purchased 0.5g gold at ₹30k.
Total gold purchased = 1 + 0.5 = 1.5 g
Total cost of gold = ₹15K + ₹15K = ₹30K
Average = = = ₹20K/g
(vi) Suvarna had purchased 1g gold at ₹15k.
Again, she purchased 0.5g gold at ₹15k.
Total gold purchased = 1 + 0.5 = 1.5 g
Total cost of gold = ₹15K + ₹7.5K = ₹22.5K
Average = = = ₹15K/g
6. Given some data with corresponding weights, how would the weighted average change if all the weights are doubled? If required, experiment with some data. What do you observe? Justify your answer using algebra.
Solution:
Let the given data be x1, x2, x3 with corresponding weights w1, w2, w3.
Original weighted average = x =
On doubling the weights,
Weighted average = x’ = = =
Thus, x = x’
Therefore, there is no change in the weighted average if all the weights are doubled.
7. Answer the following questions based on the graph.
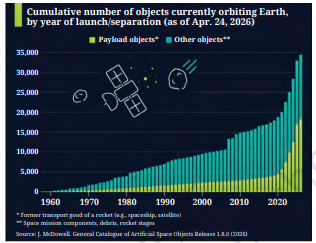
(i) In 2003, approximately how many total objects were found orbiting Earth in space? In what year did this number double?
Solution:
About 10,000 objects were found orbiting Earth in space in 2003. However, the number of orbiting objects doubled in 2021.
(ii) Find the approximate number and share of payload objects and other objects in the year 2025.
Solution:
About 33,000 objects were orbiting Earth in 2025. Of these, 17,000 were payloads, and 16,000 were other objects.
Payload objects percentage = × 100% = 51.5%
Other objects percentage = × 100% = 48.5%
(iii) What can you say about the number of payload objects over time, and the number of other objects over time? What can you say about the share of payload objects over time, and the share of other objects over time?
Solution:
The number of payload objects increased gradually over the years, with a sharp rise after 2020.
The number of other objects also increased over time.
The share of payload objects in the total number of objects orbiting Earth increased over time, especially after 2020.
The share of other objects decreased over time.
8. Observe the following infographic.
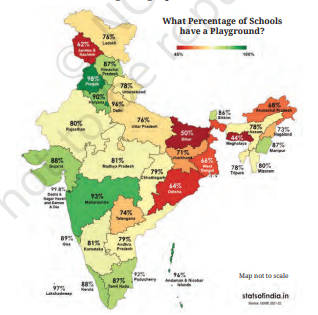
(i) Identify the correct inference(s) from the statements given.
(a) More schools have a playground in Haryana compared to Uttarakhand.
(b) Approximately every 2 out of 3 schools in Arunachal Pradesh have a playground.
(c) Punjab has the highest number of schools with a playground.
(d) Suppose it is given that Maharashtra has more schools than Telangana. Then the number of schools having a playground is more in Maharashtra.
Solution:
(a) True. Haryana has 90% of schools with playgrounds, whereas Uttarakhand has 78%.
(b) True. Approximately 67% (or two-thirds) of schools in Arunachal Pradesh have a playground.
(c) False. Dadra & Nagar Haveli and Daman & Diu have the highest percentage of schools (99.8%) with a playground.
(d) True. Maharashtra has 93% of schools with a playground, whereas Telangana has 74%. Since
Maharashtra has more schools than Telangana, it must also have more schools with a playground.
(ii) Using the information given, can we find the nationwide percentage of schools with a playground? If not, what additional information is needed?
Solution:
No, we cannot find the nationwide percentage of schools with a playground using the given information alone. This is because all states do not have the same number of schools.
We need the total number of schools in each state and union territory to compute the weighted average.
9. Decision Dilemma:
(i) Which of the plays would you choose to watch based on the following chart?
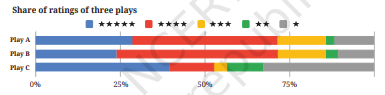
Solution:
Play A.
(ii) The corresponding stacked bar chart is shown below. Would you change your decision after looking at this chart? Why/ Why not? Discuss.
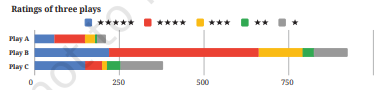
Solution:
Yes, we would change our decision to Play B.
10. A triathlon is an endurance race consisting of swimming 3.8 km, cycling 180 km, and running 42.2 km. Athletes compete for the fastest overall time, completing each segment in that order. The following table shows the finish times of 3 athletes in each segment.
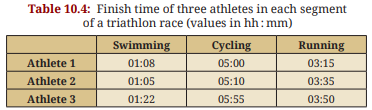
(i) What is a suitable representation of this data — a stacked bar chart or a 100% stacked bar chart? Why do you think so?
Solution:
A stacked bar chart is a suitable representation because it shows the time taken by each athlete in the three segments, as well as their total race time.
A 100% stacked bar chart shows the time spent on each segment, but it does not show the actual total race times of athletes.
(ii) Suppose a 100% stacked bar chart is drawn. Which of the following question(s) can be answered by looking at just that chart?
(a) Who finished the race first?
(b) Approximately what fraction of their race time did Athlete 1 spend cycling?
(c) Which athlete took the longest for running?
Solution:
A 100% stacked bar chart can answer:
(b) Approximately what fraction of their race time did Athlete 1 spend cycling?
It shows the fraction of Athlete 1’s total race time spent cycling.
Options (a) and (c) cannot be answered reliably from this chart alone because it shows proportions, not the actual total race times or the actual time taken for running.
11. Look at the following graph. What do you notice? What do you wonder? Write your inferences.
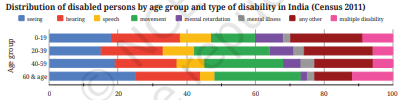
Solution:
What I notice:
1. The graph shows the distribution of disabled persons in India across four age groups according to their type of disability (Census 2011).
2. Multiple disabilities are present in all four age groups.
3. In the 0–19 age group, seeing and hearing disabilities form a significant proportion.
4. Movement disability is highest in the 40–59 and 60 & above age groups.
5. In the 60 years and above age group, seeing and movement disabilities account for the largest proportions.
6. Mental retardation is higher among younger age groups than among older age groups.
What I wonder:
1. Why is mental retardation highest in the 0–19 age group?
2. Why does movement disability increase in the middle age groups?
3. Why is hearing disability prominent among all age groups?
Inferences:
1. The type of disability varies across different age groups.
2. Seeing disability becomes more prominent in the older age group.
3. Movement disability forms a considerable proportion of disabilities among adults.
4. Different age groups may require different types of support and healthcare facilities.
12. Individual project: Do at least one of the following.
(i) Recall the previous day and fill in the approximate time spent lying down, sitting, and standing/moving around, etc. Ask at least 2 of your family members about their day and fill it in. Alternatively, you can choose to track just your own body-state for any one of the weekdays, Saturday, and Sunday. Visualise it using a stacked bar chart. Discuss with your class how you arrived at the estimated time spent in each state.
Solution:
The approximate time spent by three family members in different body states during a day:
Stacked bar chart:
Draw three horizontal bars, one for each family member. Divide each bar into three segments representing lying down, sitting, and standing/moving around.
Discussion:
The time was estimated by recalling the daily routine of each family member and asking them about
their activities.
(ii) Visualise your family’s monthly expenditure using a 100% stacked bar chart.
(a) First, identify the expense categories in your family budget.
(b) Discuss with your family members to decide how you will collect and organise the data.
(c) Collect expense data for at least 3 months.
(d) Represent the data in a 100% stacked bar chart, with each bar showing how the total monthly expenditure is divided across the different categories.
(e) Finally, write your observations and inferences based on the chart.
Solution:
(a) The expense categories in our family budget are:
1. Rent
2. Groceries
3. Bills
4. Education
5. Transportation
6. Savings
(b) The data were collected by discussing the family budget with family members and organising the data into different categories.
(c) The following table shows the family’s expense data for three months:
(d) Percentage =
The percentage share of each expense category is given in the table below:
100% stacked bar chart:
Represent March, April, and May using three equal-length bars. Divide each bar into six segments according to the percentage share of each expense category.
(e) Observations:
1. Rent remained constant throughout all three months.
2. Grocery expenditure increased gradually from March to May.
3. Electricity and water expenses also increased during this period.
4. Education expenses remained unchanged.
5. Transportation expenses showed slight variations.
6. Other expenses decreased from March to May.
Inference: The family spent the most on groceries, while rent remained fixed. The family maintained a stable monthly budget of ₹30,000, although the expense distribution changed slightly over the three months.
13. Small-group project: Make a group of 3–4 students. Choose one scenario to design a custom rating scheme by assigning appropriate weights: (a) shopping experience at a cloth store, (b) travel experience in a bus, (c) tourism experience of a nearby tourist spot, (d) clinic/hospital experience
(i) Discuss and arrive at 4–6 aspects to rate. For each aspect chosen, justify why it matters for an overall experience.
(ii) Discuss and decide the relative weights and justify.
(iii) Collect or imagine ratings from at least 10 people on a scale of 1–5 (5 being very good).
(iv) Compute each individual rating. Compute the overall average across individuals.
(v) Make a 100% stacked bar chart using your data.
(vi) Write a short note on the observations and inferences, what your rating system captures well and what it misses.
Solution:
Chosen scenario: (a) Shopping experience at a cloth store
(i) The aspects affecting the shopping experience are:
(ii) The group assigns the following weights according to the importance of each aspect.
Quality of clothes is the most important factor in customers’ satisfaction and is given the highest weight. Billing is given the lowest weight because it has less influence on the shopping experience.
(iii) The imaginary ratings are:
(iv) Weighted rating =
So,
For customer 1: Weighted rating = = = = 4.5
Similarly, the ratings of other customers are calculated.
Overall average rating = = = 4.05
Therefore, the overall average shopping experience rating is 4.05 out of 5.
(v) 100% stacked bar chart:
The percentages are calculated by converting each customer’s weighted ratings into percentages of their total weighted score.
For example:
For customer 1
The weights are:
Quality = 30%
Variety = 20%
Price = 20%
Staff = 20%
Billing = 10%
Customer 1’s ratings are 5, 4, 4, 5, and 4, respectively.
Percentage = × 100
∴ Quality = × 100% = 33.3%
Variety = × 100% = 17.8%
Price = × 100% = 17.8%
Staff = × 100% = 22.2%
Billing = × 100% = 8.9%
Similarly, the percentage contribution of each aspect for other customers is calculated and is given below in the table:
(vi) Observations:
1. The overall average rating is 4.05 out of 5, indicating a good shopping experience.
2. Customer 7 gave the highest rating of 4.8.
3. Customer 9 gave the lowest rating of 3.5.
4. Quality of clothes and staff behaviour received relatively high average ratings.
5. Price received the lowest average rating among the five aspects.
Inferences:
The clothing store provides a good overall shopping experience. Customers are generally satisfied with the quality of clothes and staff behaviour. However, the store can improve customer satisfaction by offering clothes at more affordable prices.
What the rating system captures well:
It considers different aspects of shopping and gives greater importance to those that matter more to customers.
What it misses:
Customer preferences may differ, and a rating scale cannot fully capture personal experiences, suggestions, or individual expectations. Also, the weights are based on the group’s judgement and may not represent every customer’s priorities.
14. Whole class project: Each student shares the average age of their family and the number of family members. Discuss among the class and come up with a way to find out the average age of all the families of the class.
Solution:
Suppose five students share the average age of their family and the number of family members, as shown below:
Average age =
=
=
= = 23.8 years
Therefore, the average age of all the family members of the class is 23.8 years.
15. Given some data with corresponding weights, what would happen to the weighted average if all the weights are increased by a constant value, say 1? If required, experiment with some data. What do you observe? Justify your answer using algebra.
Solution:
Let x1, x2, x3, x4 be the given data with corresponding weights w1, w2, w3, w4.
Original weighted average =
If each weight is increased by 1, then
The new weights would be (w1 + 1), (w2 + 1), (w3 + 1), (w4 + 1).
∴ New weighted average =
=
=
Thus,
Original weighted average ≠ New weighted average.
Therefore, increasing every weight by 1 may change the weighted average, because the same constant added to each weight does not cancel from the numerator and denominator.
16. A farm has some cows, sheep, and chickens. Last year the cows made up 60%, the sheep 25%, and the chickens 15%. There was a decrease in the number of all three animals’ population over the year. Choose the possibilities for the change in their respective shares of the population —
(i) % of cows decreased, % of sheep decreased, % of chickens decreased
(ii) % of cows increased, % of sheep increased, % of chickens increased
(iii) % of cows remained the same, % of sheep remained the same, % of chickens remained the same
(iv) % of cows decreased, % of sheep increased, % of chickens remained the same
(v) % of cows increased, % of sheep increased, % of chickens decreased.
Solution:
(i) Not possible. All three shares cannot decrease simultaneously because their percentages must add up to 100%.
(ii) Not possible. All three shares cannot increase simultaneously because their percentages must add up to 100%.
(iii) Possible. If the population of all three animals decreases in the same proportion, their percentage share remains unchanged.
(iv) Possible. The shares of cows and sheep may change in opposite directions while the share of chickens remains the same, keeping the percentage at 100%.
(v) Possible. The shares of cows and sheep may increase while the share of chickens decreases, keeping the overall percentage at 100%.
